
🖕 COVID-19
AsyncAPI Community is stronger than you think.
See the growth of AsyncAPI in 2020 in hard numbers. How do we compare to 2019?
This post is based on quantitative data using metrics from different platforms where AsyncAPI is present. I collected this data between 15-17.12, so they are already a bit larger by now. I'll try to confront our qualitative knowledge, what we know from discussions with others, and our observations.
This post is not 100% just in numbers and analytics. It is also a summary of all the important things that happened to the project this year.
Important moments
- Our first ever AsyncAPI Online Conference. This pandemic edition turned out to be a very successful event that powered us up for the rest of the year
- We took active part in Hacktoberfest as maintainers and increased the number of contributions to the project
- AsyncAPI was featured in InfoQ's Software Architecture and Design InfoQ Trends Report—April 2020 that directly brought 1963 new users to the AsyncAPI website
- AsyncAPI showed up on Technology Radar that took 1051 users directly to the AsyncAPI website
- Our two core tools reached their first major release
All those moments lead us to the most important one: the partnership with Postman.
Slack
tl;dr AsyncAPI community activity on our Slack workspace doubled!

Figure 1: Slack active members weekly
Numbers getting high
I don't think the below tables require any introduction.
More members means higher activity 😅
Most present companies
I was also super curious to check out where our members are coming from. The only way to do it was by checking the domain of their emails used during registration. Yes, this is not 100% accurate. Not all people use company emails in open source. It is visible in data; half of the users have the gmail.com domain. Nevertheless, the result of my investigation is pretty accurate with our knowledge. The ones that have more than three representants:
- mulesoft.com
- postman.com
- redhat.com
- sap.com
- smartbear.com
- solace.com
- tibco.com
- worldpay.com
Some of these companies sponsored our work in 2020. The ones that didn't... don't worry, we'll contact you 😉 In 2021, we want to go into a neutral ground (i.e., joining a foundation). There'll be no more excuses.
What's next with Slack
Slack hard numbers confirm what we see in Slack every day. Luckily, even though the activity doubled, the number of active users that help out in the workspace also grew 🙏 With the recently announced Postman partnership, I do not worry about how we'll handle 2021.
Next year we need to address two critical topics:
- our community grows but the knowledge that we all share in Slack is lost. We use a free version of Slack, and therefore, only the last 10k messages are available. In 2021, we need to make a strong decision on what's next. Should we spend some budget on Slack commercial subscriptions, or maybe we should find a better tool?
- we need to reorganize our channels, be a bit more granular, and target suitable community groups. We'll bother you to get your feedback once we start this reorganization.
LinkedIn grew a lot this year. We won't be able to compare this year with the previous one because... this is not a place where I want to discuss the experience you get with LinkedIn.
Followers and impressions
At the moment, we have 757 followers.
People that like our updates are most likely the ones that click on links. 75% (947) of likes converted into visits to our website. We took this data from Google Analytics, and we know that in 2019 we had only 137 visits from LinkedIn.
The most performing update was the one about the partnership with Postman. It is LinkedIn, and it is all about business.
The chart below shows that data match reality. The highest peak in late March is related to our first AsyncAPI Online Conference. The rise of sponsored traffic is connected to our post-conference activities using the money we got from conference sponsors.
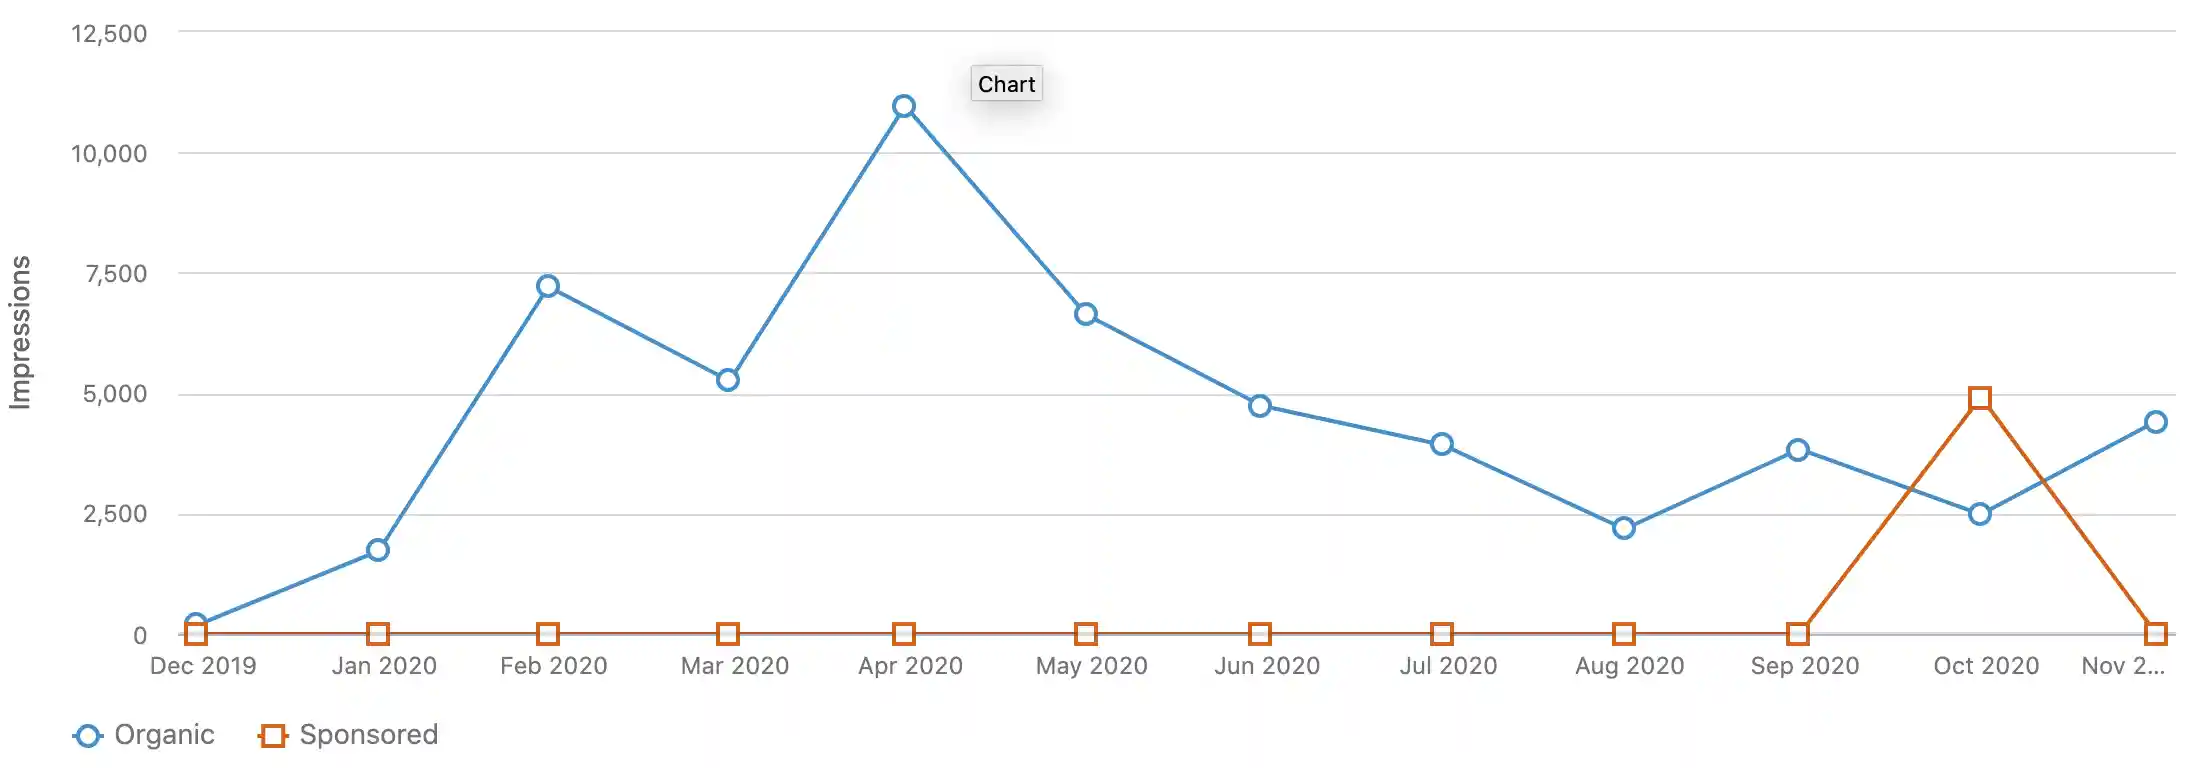
Figure 2: Impressions to updates in 2020
Sponsored marketing
This year we explored paid adverts on LinkedIn. We had some money left from sponsors of our AsyncAPI conference but zero experience with LinkedIn.
Luckily, we have a fantastic community. One of the community members, Dan Weese, helped us here. He did not only put us in contact with marketing expert, Charles Serdou but also covered his wages. Thank you, Dan 🙏
This way, we covered only LinkedIn costs paying $1 074,08
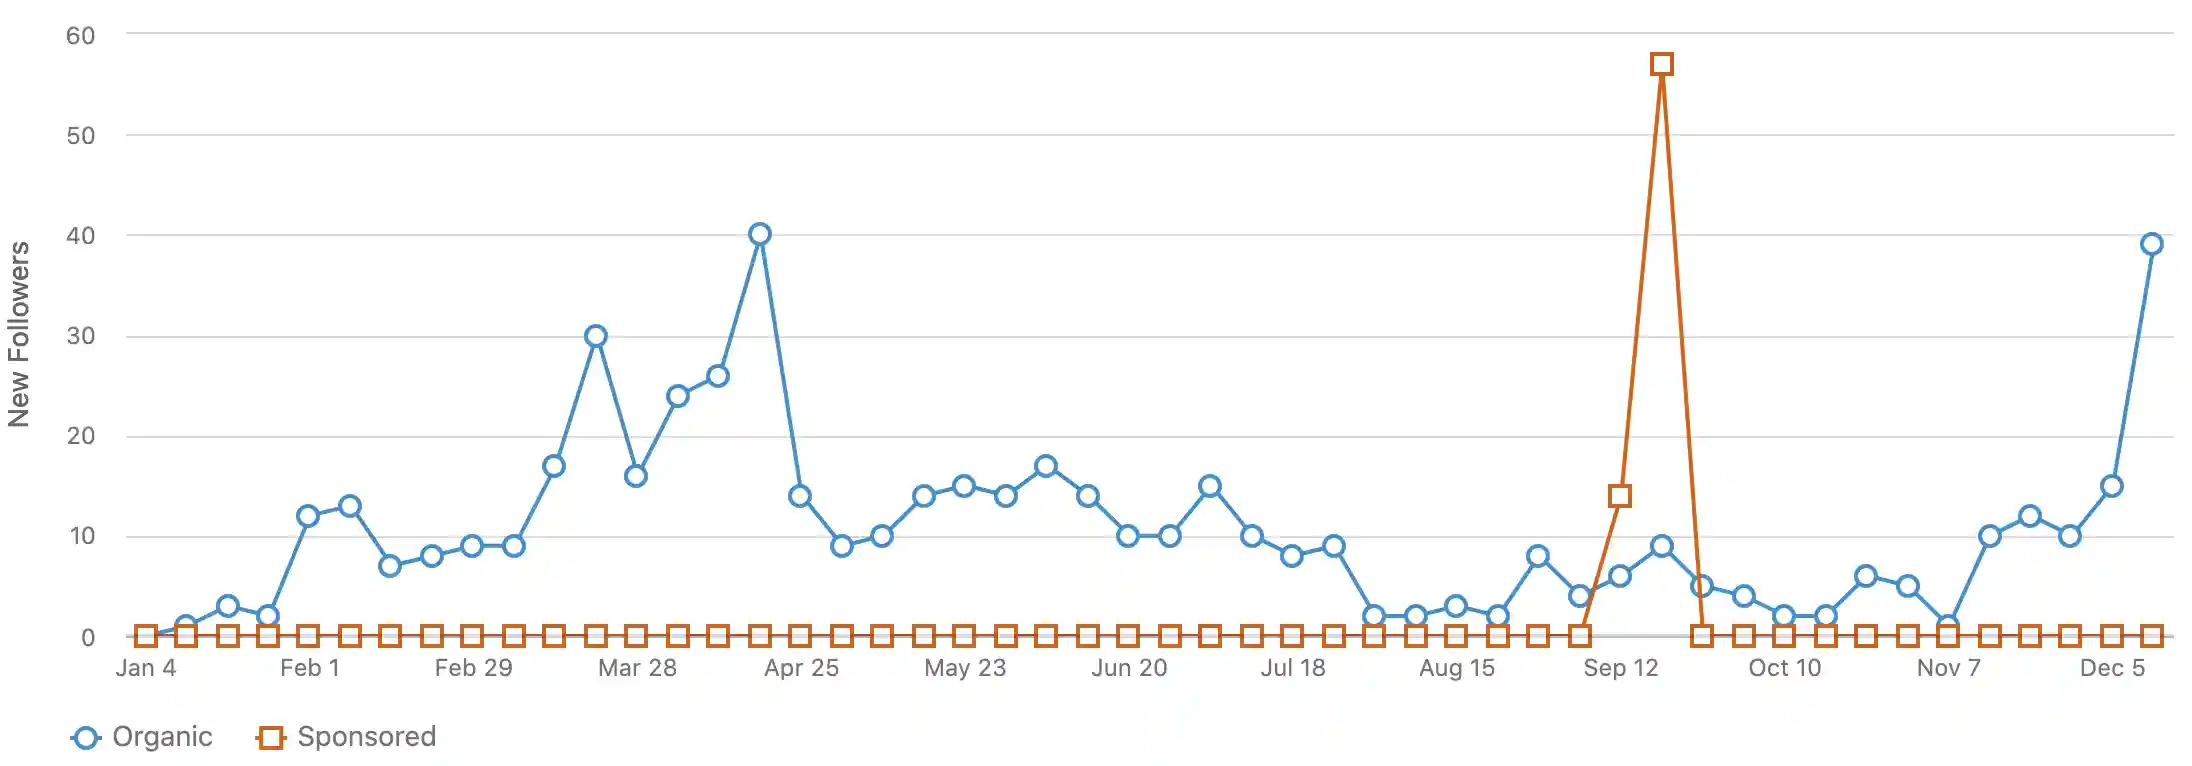
Figure 3: Followers growth in 2020
Marketing was focused on increasing the number of followers. Comparing the results of sponsored marketing with followers' organic growth, one could say LinkedIn marketing was not so good. It was very good though. LinkedIn is just super expensive and charged a lot for every new follower.
We should give it a second chance in 2021, but this time with sponsored updates.
What's next with LinkedIn
The numbers show it is worth investing in the channel. We can reach a lot of people that are not reachable on other channels. So we will for sure continue what we do now, especially that this work doesn't require too much extra effort from us.
I feel that probably some traffic coming from LinkedIn to our website is not adequately tracked in Google Analytics. Data from LinkedIn say we should notice 2x947 traffic. It might be related to people blocking tracking tools, and we will have to make sure to use other tracking methods, like putting identifiers in the links.
Google Analytics
We use Google Analytics on AsyncAPI website because we want to understand what content is most valuable for you, and we want to learn how the interest is growing.
Traffic got much higher
The interest is growing by a lot! Our website handles it well with the support of Netlify, which is free for open-source projects.
Top referring channels
If we look closer to the statistics to check out how people learn about AsyncAPI, referral channels keep pretty much the same share of the pie, just numbers grow.
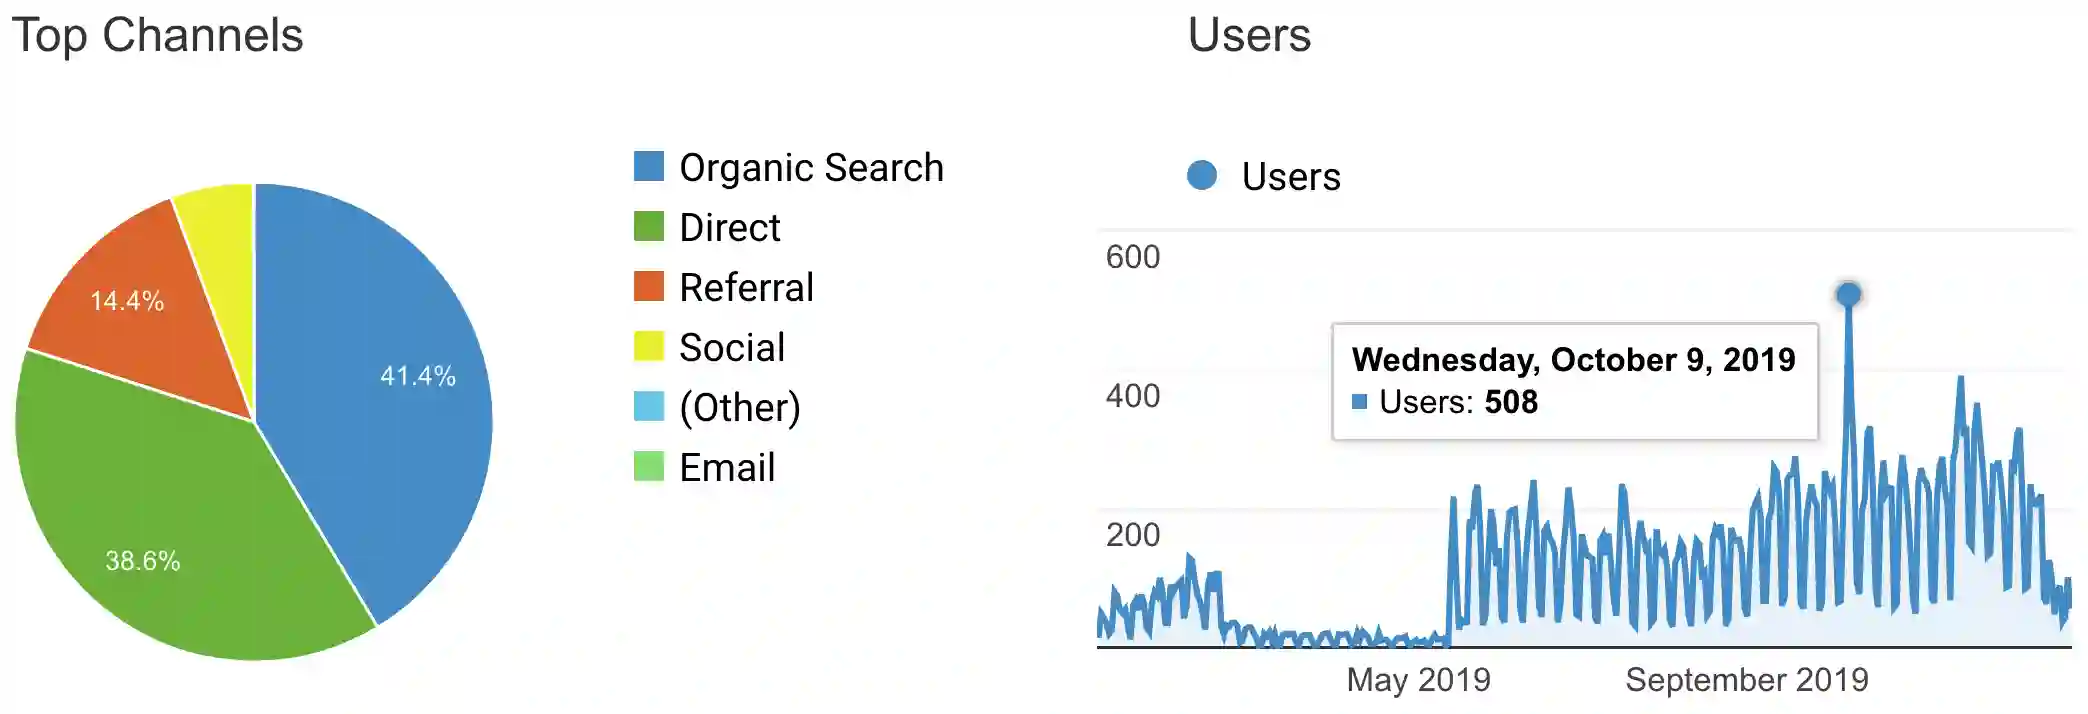
Figure 4: Top channels in 2019
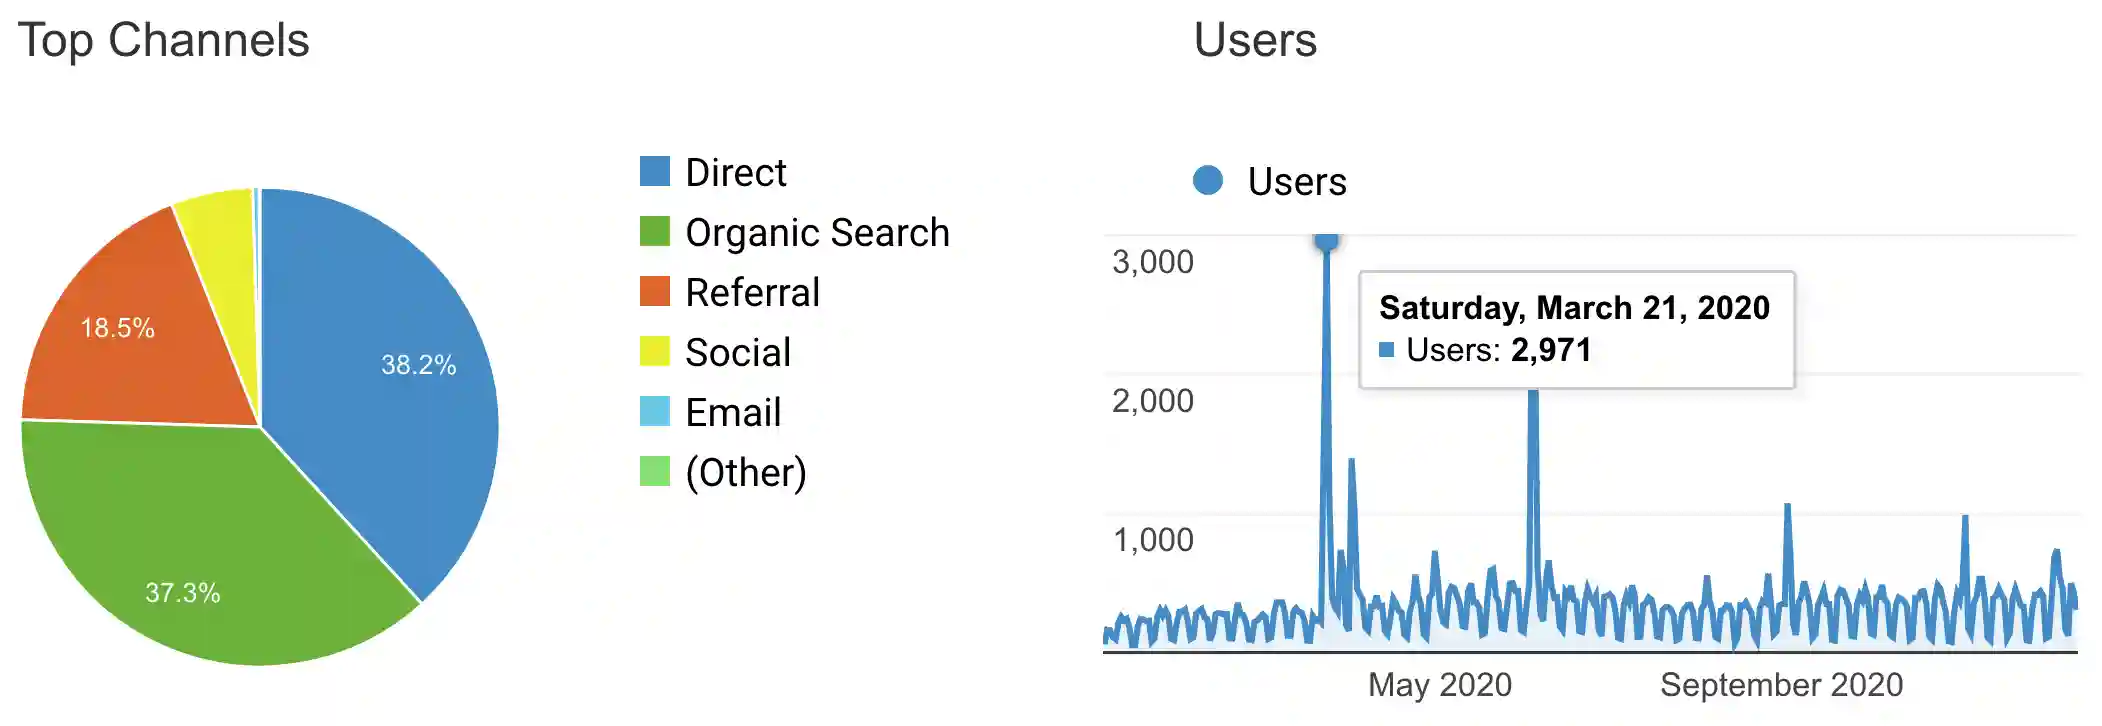
Figure 5: Top channels in 2020
In 2019, the most viral was the information about AsyncAPI 2.0 release, while in 2020, the blog post about how we automated releases on AsyncAPI packages to speed up work.
Top blog posts
AsyncAPI blog is not just for Fran and me. It is for the AsyncAPI Community. Anyone can share knowledge, experience, and showcase their work there. Just let us know what you want to write about.
What is the benefit of writing/republishing on the AsyncAPI blog? Visibility among the AsyncAPI community plus our activities to make your work go viral. Just look at the below table to see our top 3 viral posts.
What's next with the website
We need to enable Google Search Console and connect with our Google Analytics account. It will increase our knowledge about how people google before they get into the AsyncAPI website. Knowing how people find us, we can focus on more content related to search queries.
We need more posts on our blog. 2020 shows this is something that increases traffic. We already welcomed many guest bloggers, and you can become one of our writers too.
By the time I gathered data for this blog post, we had 1433 followers on Twitter. 876 followers joined us in 2020. It is a large increase since the account creation back in March 2019.
Paid marketing
We used money from our AsyncAPI conference sponsors to advertise the conference on Twitter.
We spent $924,14 on this activity and when we compare it to organic impressions over this year, result is just great:
Nothing is black and white, even Twitter performance. One could say:
leave organic growth and invest in paid marketing
We do not treat Twitter as just a marketing channel. It is our window to the community. We use it to share updates, short information and engage directly with our community members. We should continue to work on organic growth. It converted only into 2 160 sessions to the AsyncAPI website, which is not much if we compare it with 2 283 sessions opened with the AsyncAPI Conference website using promoted content. We do not want to close the window, though.
It's all about keeping the balance ⚖️
Top tweets
We did some research on the most impressive and engaging tweets.
There is only one tweet that shows up in the top 3 for each category.
It is pretty clear that what you liked the most this year is that we are hiring 💪
We are still hiring!
What's next with Twitter
We should get more insights into how Twitter activity converts into visits to our website. Twitter offers something called conversion tracking which seems like a perfect fit, and this is something we will enable for next year.
Paid marketing on Twitter is useful, so we will continue using it for important events.
GitHub
We notice growing traffic in our GitHub organization like on other channels.
Most popular repositories
Our most popular repositories contain the AsyncAPI specification and the AsyncAPI Generator that the community can use to generate documentation and code.
The asyncapi repository that had 245 stars in 2019 jumped to 1361. The peak you see on the diagram was caused by us putting the link to the asyncapi repository on Hacker News.
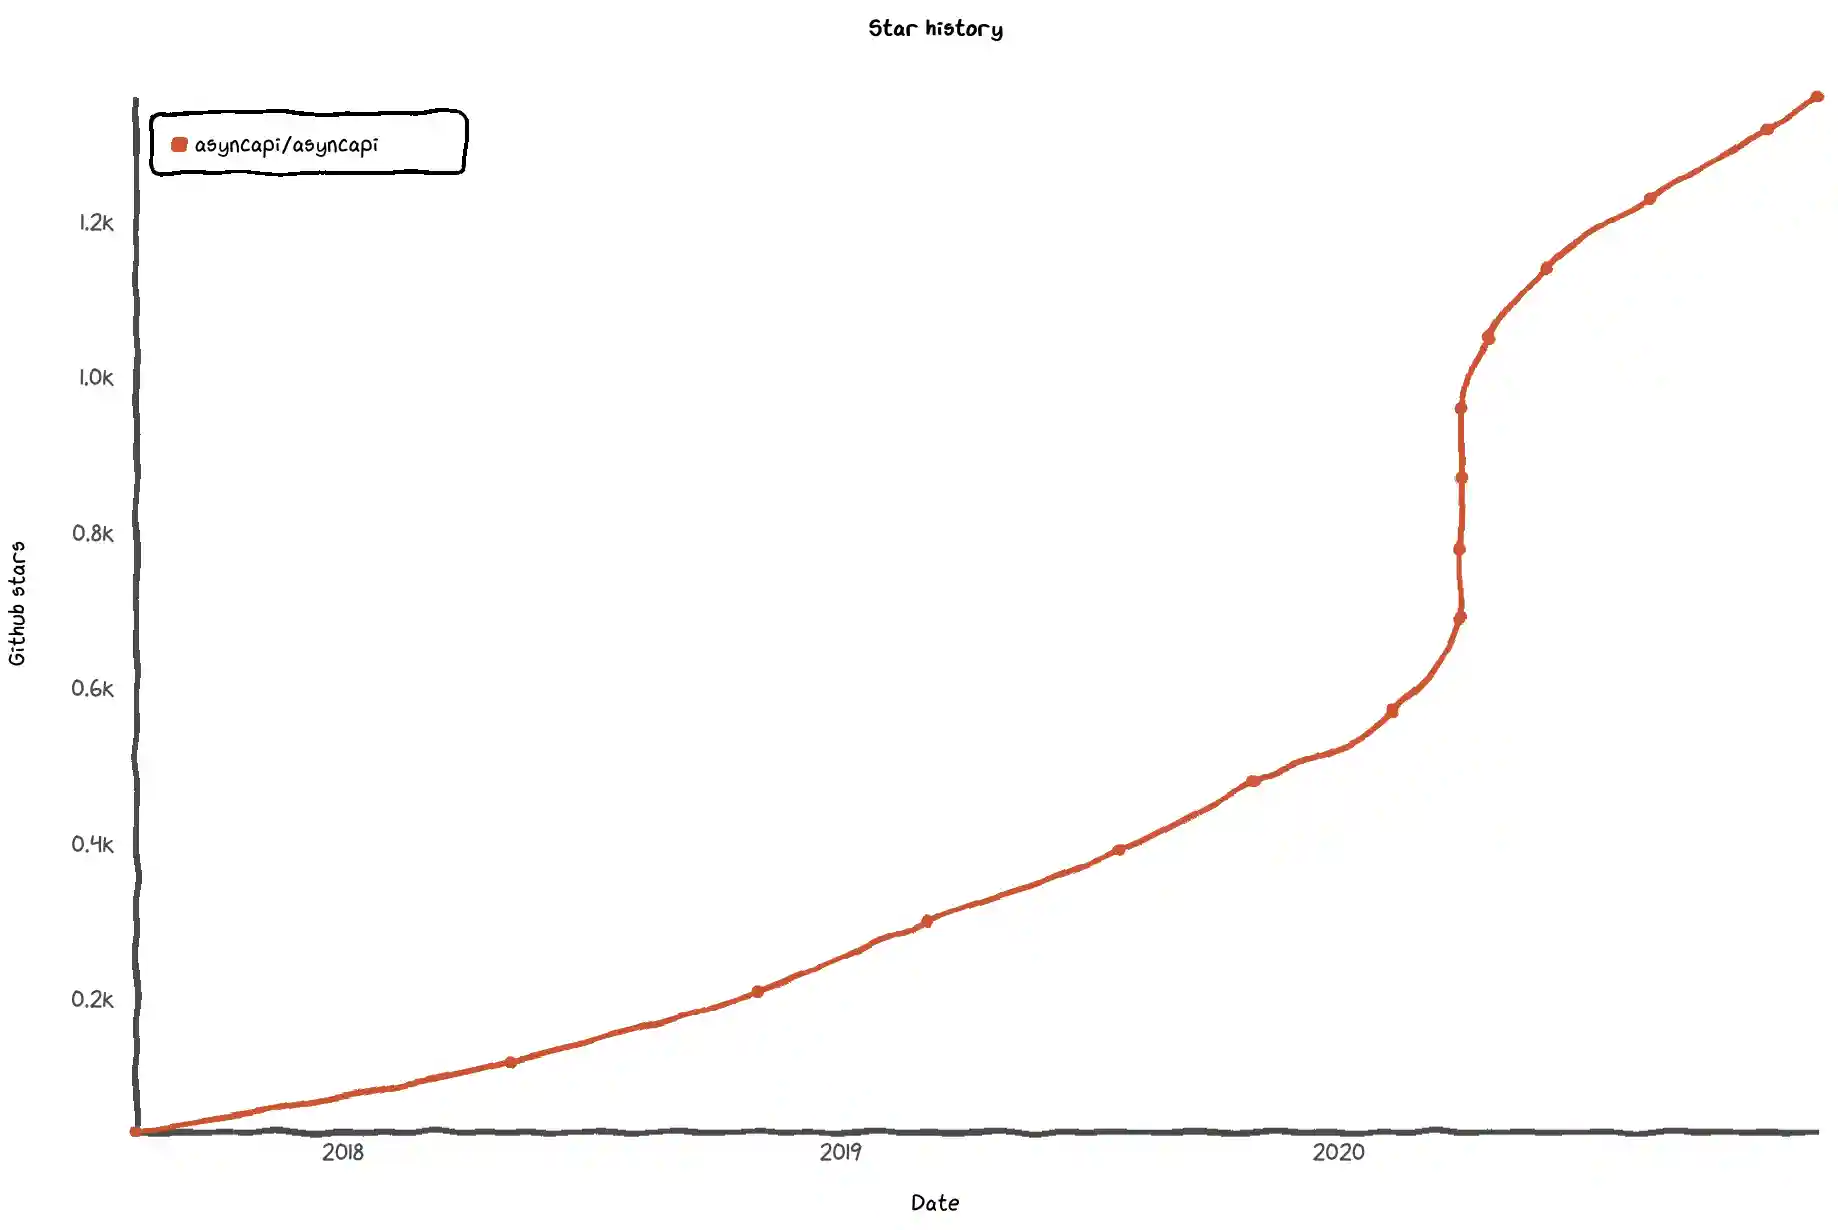
Figure 6: GitHub stars growth in asyncapi repository
The generator repository grew from 62 to 198. The path got steeper this year. This popularity is covered with our recent development activities in the project.
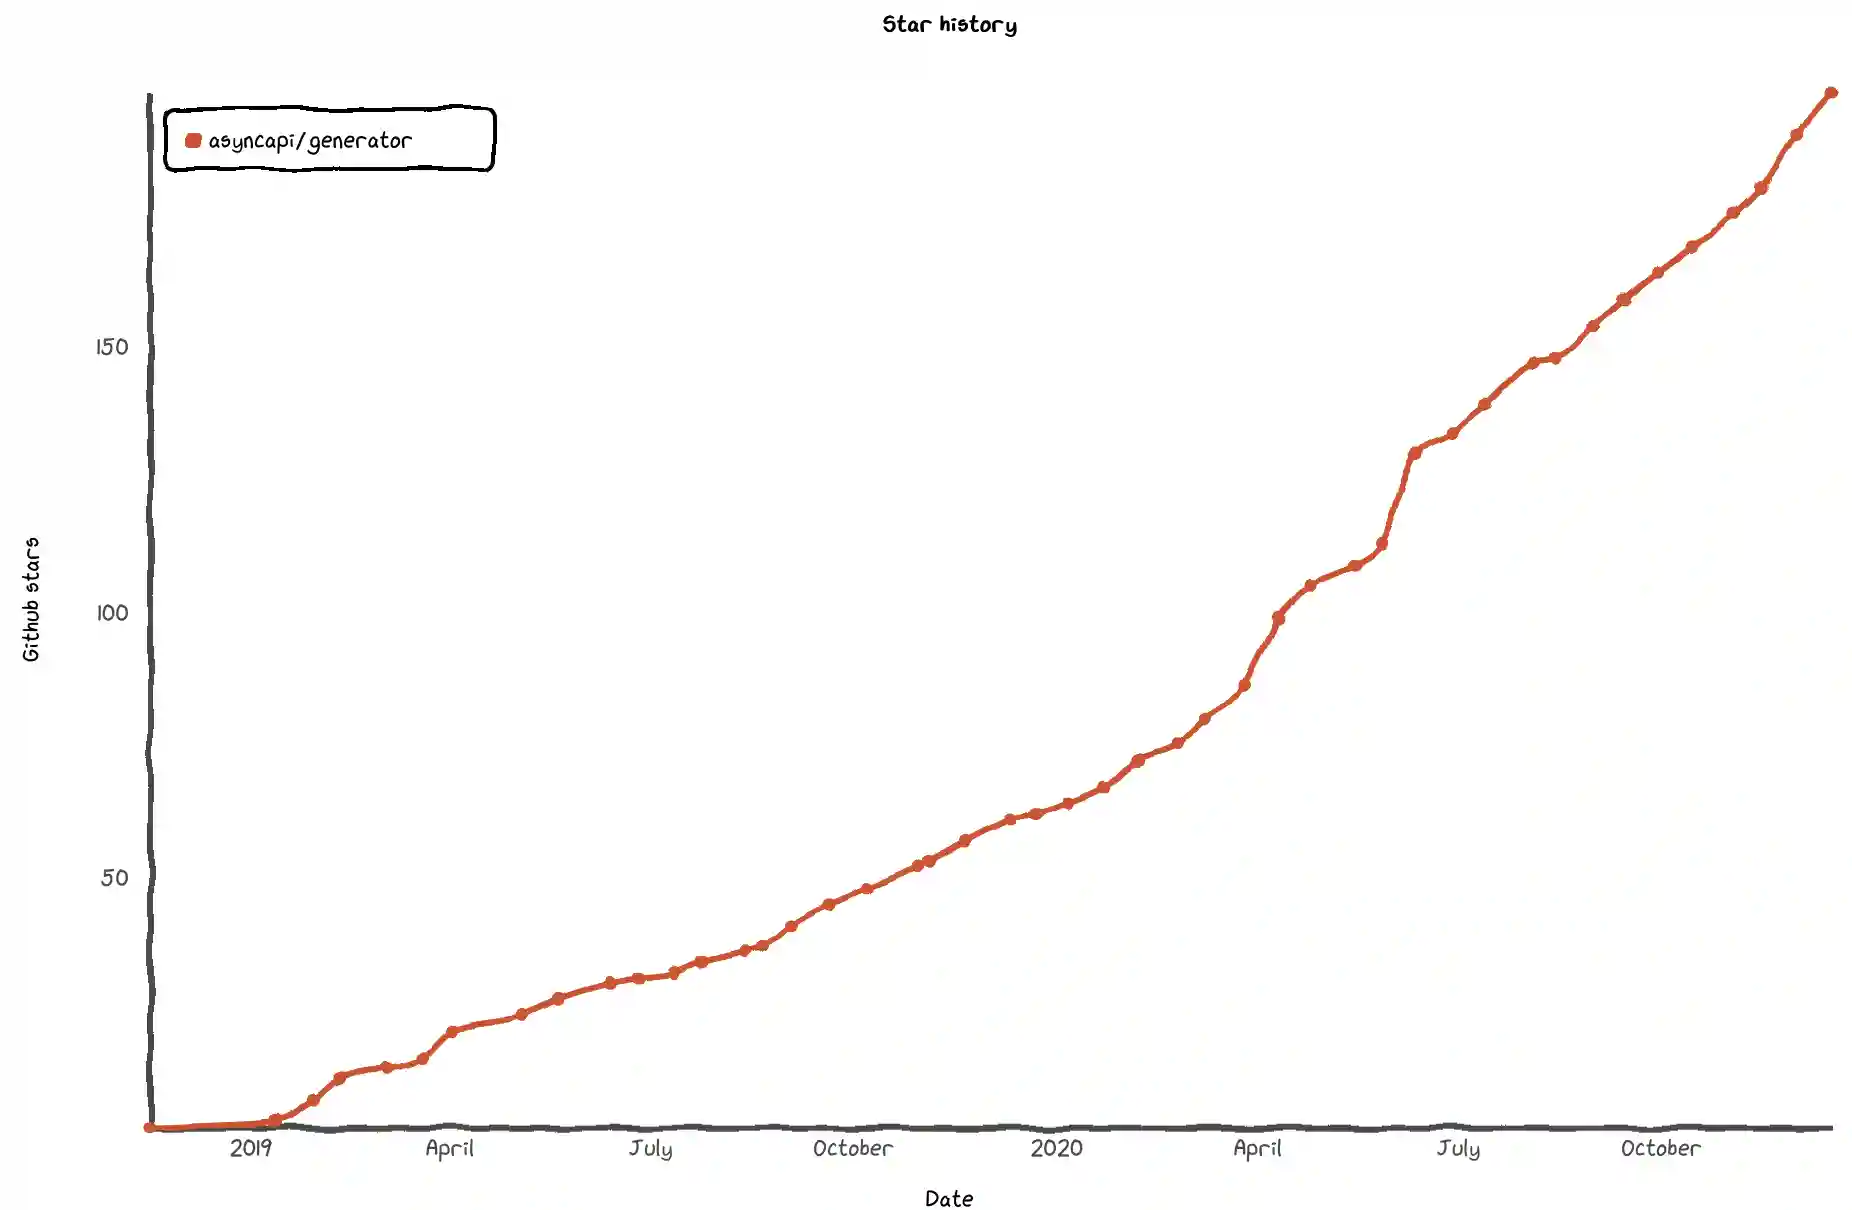
Figure 7: GitHub stars growth in generator repository
Traffic growth
All numbers went up 😅
The growth of contributors was not organic but driven by our activities in the Hacktoberfest event.
We're closing fewer issues. This number got worse than last year because we freeze progress on the asyncapi repository, and the last few months did not continue any efforts towards specification 2.1 and 3.0 releases. The reason was pretty simple; we were involved in discussions with many players and planning the next step forward to scale up in 2021. It would not be fair with the AsyncAPI community to work on the next specification versions, with the current government process, knowing we prepare partnership with Postman.
What's next with GitHub
We are doing well on GitHub, and so far, I don't see any improvements other than the further automation that we have in plans to handle even more traffic next year.
npm
The majority of our tools are written in JavaScript/TypeScript, and we host them on Node Package Manager(npm)
Top packages
Our most important packages are the Generator and the Parser. Below you can see how downloads of these packages increased.
The change in numbers is so huge that I checked them twice to make sure I'm not wrong.
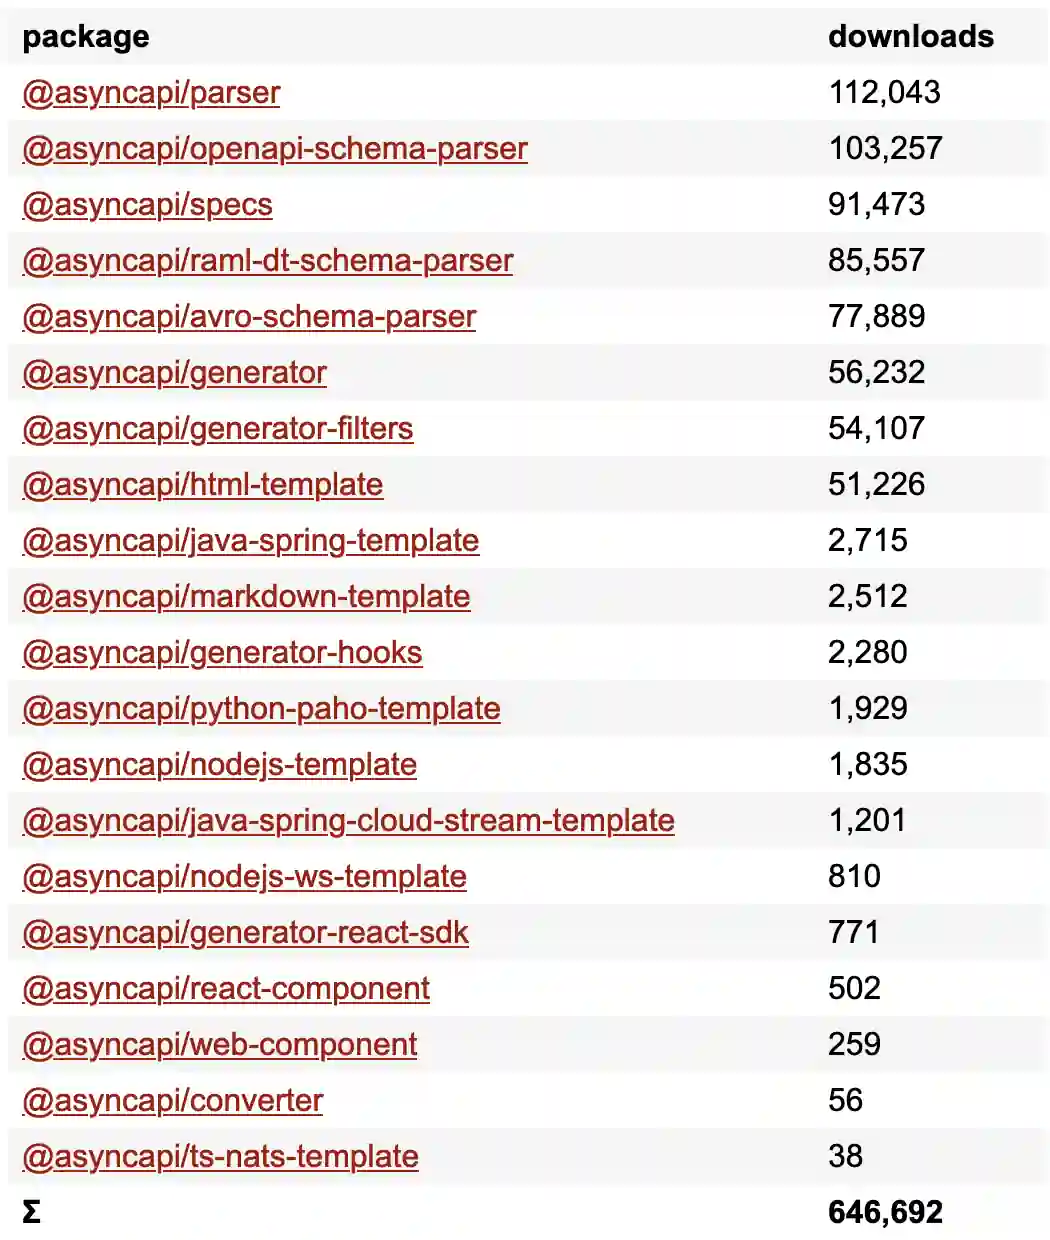
Figure 8: Popularity of all packages on npm
If you know the package from the above list had some different names over the year, you can check it with npm stat project. For example, late in the year, we moved the React component under @asyncapi, and under the old name, it had 56 520 downloads. Next year won't be so messy.
What's next with npm
This year we introduced @asyncapi scope on npm and switched all packages to it. You could see some differences in numbers in previous sections because for the generator and parser I manually counted the sum of downloads of a package under different names.
There are still many downloads of the parser and generator using old names. It means we still have many people that do not migrate to new releases. Next year we could write a blog post that summarizes the differences between old tools and their latest versions. It could be linked to the deprecation notice.
YouTube
The AsyncAPI YouTube channel had a massive increase in the traffic.
Watch time goes crazy
We felt it might be significant because of the AsyncAPI conference, but we never expected a 6000% growth of the watch time!
Most popular videos
Undeniably the most popular this year was our first AsyncAPI online conference.
In case you missed our conference, watch the recording and stay tuned for the next conference in 2021.
What's next with YouTube
I think it is the right moment to work on the channels' landing page. We could use it to promote the most valuable content.
Open Collective
We earned and spent lots of money this year 🤑
Huge applause 👏 to all our sponsors!
We enabled the GitHub sponsoring this year, but still, 99% of funds go through the Open Collective.
In 2021 we continue using Open Collective. Even though we started partnership with Postman to cover many maintenance costs, there are other costs. Even once we join some foundation next year, we still need to collect money to run the project.
Ultimate questions - how many people use the spec?
We don't know.
It is the area where we have no specific metrics. We see the growth in tools' adoption, but not everybody uses open source tools. Many companies prefer to develop those in-house.
From observations, we know that number of users that use specification grows:
- More and more companies seek integration with the specification. From unofficial discussions, we know their customers ask them about AsyncAPI support
- The metrics from this blog post clearly show adoption and interest growth
It is a specification we are talking about here. There is no way to measure how many AsyncAPI files were created worldwide. At least there was no way to do it in 2020. We'll try one idea of ours in 2021. It looks like in the 2021 summary, we could provide some hard numbers on the subject 🤞
Final words
Most important conclusion: If the AsyncAPI conference brought so much activity, it is evident that in 2021 we must organize another great AsyncAPI event.
Thanks for being with us in 2020, and stay with us for 2021 as it will be epic!
I planned to include a list of all the AsyncAPI Heroes for 2020, but I was afraid I could miss someone very important and that the list would be very subjective. I hope it is clear, though, that this project is where it is, thanks to many guardian angels out there that help us out.
Photo by Immo Wegmann on Unsplash